This guide is gated. Enter your email to request access โ you'll receive a link once approved.
Already have access? Open your magic link email to unlock.
From your first trade to your first consistent strategy โ everything you need to understand, analyze, and profit from Volatility Indices. Built from real experience, not textbooks.
Section 1
Every trader has a turning point. Mine was the day I accidentally stumbled into Volatility Indices โ and I never looked back.
You probably knew me as a Forex trader. I began my trading journey with currencies, then expanded into Stocks, Crypto, and Indices โ sharpening my skills as an analyst across every asset class I touched. But my journey took a defining turn the day I was introduced to Volatility Indices.
What I found was something that re-ignited everything I loved about trading. The pure price action. The 24/7 access. The lack of manipulation. I took a step back from Forex and spent months backtesting, studying, and applying different strategies specifically to VIX โ until I built a trading system that consistently delivered high-probability setups.
That system became the foundation of everything I share. This guide is the upgraded version โ fused with cutting-edge educational material from Deriv โ to give you the most complete starting point I've ever put together. Whether you're brand new to trading or coming in with experience, there's something here built specifically for you.
Welcome. Let's build your edge. โ UrAvgTrader
This guide is organized in tiers. Look for the Beginner and Intermediate labels throughout. Beginners should read start to finish. If you already know the basics, jump straight to the VIX Strategy section.
Section 2
BeginnerIf you've never traded Synthetic Indices before, this section will give you a clear, complete understanding of what they are and why they're special.
Synthetic Indices are simulated financial instruments that mimic the behavior of real-world markets โ without being tied to real-world events. They move through a cryptographically secured random number generator that is independently audited for fairness. No bank. No central government. No manipulation from big institutional players.
Think of them as markets engineered to behave like real markets โ with real patterns, real trends, and real opportunities โ but without the noise of economic news or political disruption.
Because the price generator is a computer program with no outside interference, pure price action concepts โ support and resistance, Fibonacci levels, breakout patterns โ actually work here. The market respects structure. That's what makes VIX a trader's dream.
Trade any time โ weekends, holidays, Christmas. No session times, no gaps. Your schedule is the only limit.
Powered by a certified RNG โ no hedge funds, no banks, no institutions moving price against your position.
Unlike Forex, volatility stays consistent. No NFP spikes. No overnight gaps. What you see is what you trade.
Start with as little as $5 on a real account, or practice risk-free with $10,000 in virtual funds on a demo.
Support and resistance levels are respected. Fibonacci levels work. Break-and-retest setups are clean.
Among the tightest spreads in the industry โ your orders execute with precision and your targets get hit cleanly.
Some indices (especially VIX75 and VIX100) are extremely volatile and can move fast enough to wipe an account. Large stop losses are required on higher-volatility indices. The 24/7 nature can encourage overtrading in traders who lack discipline. And Deriv sometimes goes offline for scheduled maintenance โ always stay informed via their official channels.
Section 3
BeginnerDeriv offers a wide range of Synthetic Indices. Here's your complete map of what's available โ and what to focus on as a beginner.
These are the primary instruments covered in this guide โ and the ones I personally trade. They simulate real-world market volatility at different intensities, giving you full control over how much risk you take on.
| Index | Volatility Level | Tick Speed | Min Lot Size | Best For |
|---|---|---|---|---|
| VIX 10 | 10% volatility | 2 seconds | 0.005 | Complete beginners |
| VIX 25 (1s) โ "25s" | 25% volatility | 1 second | 0.005 | Beginners โ Intermediate |
| VIX 50 (1s) โ "50s" | 50% volatility | 1 second | 0.005 | Intermediate |
| VIX 75 โ "R75" | 75% volatility | 2 seconds | 0.001 | IntermediateโAdvanced |
| VIX 100 (1s) โ "100s" | 100% volatility | 1 second | 0.10 | IntermediateโAdvanced |
| VIX 250 (1s) | 250% volatility | 1 second | 0.001 | Experienced only |
๐ก The (1s) versions update every second โ faster action, more volatile. Normal versions update every 2 seconds. Same volatility number does NOT mean same price movement.
Crash Indices are programmed for sudden drops; Boom Indices for rapid surges. The number (300, 500, 1000) indicates how frequently a crash or boom occurs on average per tick. Great for traders who like to ride strong directional moves.
These shift between bullish, bearish, and sideways trends at set intervals (10, 20, or 30 minutes on average). Ideal for swing traders who use stop-and-reverse strategies.
Price moves in fixed steps (0.1 to 0.5) with each tick โ no wild swings. Predictable and steady. Great for trend-following strategies using moving averages.
Price bounces between upper and lower boundaries, with sudden breakouts creating a new range. Breakouts happen every 100 or 200 boundary hits on average.
Spike dramatically every 15, 30, or 45 minutes on average โ with smaller price moves in between. High-risk, high-reward for experienced traders who time the spikes.
Simulate simplified bull and bear market trends. Each index resets daily to a baseline โ useful for traders who want a fresh market every day.
Start with VIX 10 or VIX 25 until you're comfortable with how these markets move. Then step up to VIX 75 and the 1-second indices. Never start on VIX 250 โ it moves so fast that even experienced traders can get caught off guard.
Section 4
BeginnerIf you're coming from Forex, here's the direct comparison so you know exactly what's different and what stays the same.
| Feature | Synthetic Indices | Forex |
|---|---|---|
| Market Hours | โ 24/7/365 | 24/5 (weekdays only) |
| Volatility | โ Constant, predictable | Variable โ depends on news, sessions |
| Manipulation Risk | โ Very low (RNG-based) | High โ banks, institutions, HFT |
| News Events Impact | โ None | Major impact (NFP, FOMC, CPI, etc.) |
| Price Action Clarity | โ Very clean S/R levels | Moderate โ fake outs are common |
| Broker Options | Deriv only | โ Many brokers |
| Lot Size Complexity | Different per index | โ Standardized |
| Spreads | โ Very tight (as low as 1 pt) | Varies by broker and pair |
| Min Deposit | โ As low as $5 | Varies โ often $100+ |
| Weekend Trading | โ Yes | โ No |
If you know how to read price action and trade Forex, you already have the foundation to trade Synthetics โ and you'll likely find it cleaner. The same skills apply. The main difference is the absence of fundamental noise, which actually makes technical analysis more reliable here than in any other market I've traded.
Section 5
BeginnerDeriv is the only broker that offers Synthetic Indices โ and they've been doing it for over 25 years. Here's how to get set up.
The main CFD trading platform. Powerful, customizable, and familiar if you've used MT4 before. Available on web, desktop, iOS, Android, and Huawei.
CFD TradingChartsIndicators
The primary platform for Digital Options. Simple, web-based, and available on any device. Great for beginners exploring Options on Synthetics.
OptionsWeb-BasedMobile
A powerful web platform that integrates TradingView charts with direct trade execution โ your best tool for chart analysis and multi-window setups.
TradingViewCFDsMulti-Chart
Great for copy trading and automated strategies. Lets you follow proven traders, share your own trades for commission, and run trading bots via cTrader Algo.
Copy TradingBotsCommunity
I've put together YouTube tutorials walking through the platform setup step by step. Head to YouTube: UrAvgTrader for the "How to Get Started with VIX" video โ it covers everything visually in a way that this guide can't fully replicate.
Section 6
BeginnerBefore any strategy, you need to understand how to read a chart. This is the language of the market โ and once you speak it, everything else makes sense.
Candlestick charts are the industry standard for a reason. Each candlestick tells you four things about price in a given time period: where it opened, where it closed, the highest point it reached, and the lowest point it touched.
Price closed higher than it opened. Open is at the bottom of the body, close is at the top. The wicks show how high and low price traveled.
Price closed lower than it opened. Open is at the top of the body, close is at the bottom. Long wicks indicate rejection by buyers or sellers.
The same market can look completely different across different timeframes. Use higher timeframes for bias and structure, and lower timeframes for entries.
| Timeframe | What It Shows | Best Used For |
|---|---|---|
| 1 Minute (M1) | Very short-term movements, lots of signals | Scalping entries; noisy on its own |
| 5โ15 Minute | Short-term structure, good entry timeframe | Entry confirmation, scalp/day trading |
| 30 Min โ 1 Hour | Medium-term structure and trend | Entry timing on swing setups |
| 4 Hour | Broader trend direction, fewer signals | Swing trade structure and analysis |
| Daily | Overall trend, major S/R levels | Directional bias, key levels |
| Weekly | Long-term market picture | Major structure zones for all traders |
My approach: Identify the trend on the 1hr or 4hr โ Find the setup level on the 30m โ Enter on the 5m or 15m when confirmation appears. Never trade just one timeframe in isolation.
Every market, including Synthetic Indices, cycles through three states. Learning to identify which state you're in is the foundation of every good trade decision:
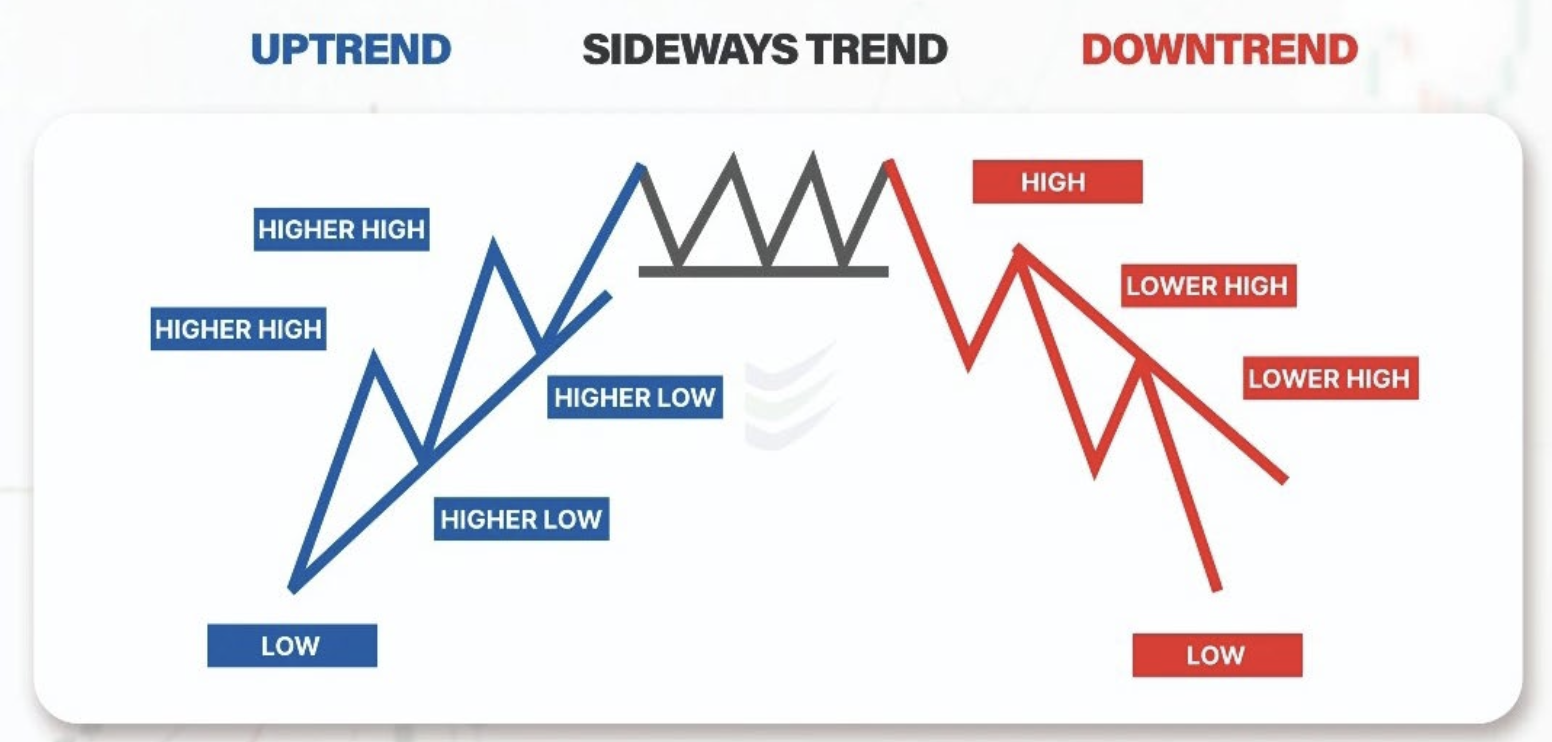
Series of higher highs and higher lows. Look for buy setups. Ride the impulse legs upward.
Series of lower highs and lower lows. Look for sell setups. Trade the impulse legs downward.
Price oscillates between support and resistance. Trade the boundaries or wait for a breakout.
Section 7
Beginner + IntermediateChart patterns are the roadmap of trader psychology. These 10 formations repeat across every market โ including all Synthetic Indices โ and knowing them gives you a structured way to plan entries, exits, and stops.
These patterns have historically predicted certain movements, but no pattern works 100% of the time. Use them as one layer of your decision-making โ never as the only reason to enter a trade. Always protect yourself with a stop loss.
Three peaks โ large middle "head" with two smaller "shoulders." Break below the neckline signals a downward reversal. Target: distance from head to neckline.
The upside-down version. Three troughs โ large middle "head" with two smaller "shoulders." Break above neckline signals an upward reversal.
Two failed attempts at a support level form a "W" shape. Price then breaks above the neckline and trends upward. Buy just above the neckline.
Two failed attempts at a resistance level form an "M" shape. Price breaks below the neckline and trends downward. Short below the neckline.
Market slowly loses momentum and forms a smooth arc downward. Each high is lower than the last. Break below the neckline confirms a reversal.
Market forms a smooth U-shape base. A series of higher lows followed by a breakout above the cup rim confirms the bullish reversal.
A rounding bottom (the "cup") followed by a small consolidation dip (the "handle"). Breakout above the handle rim signals a strong bullish continuation.
Horizontal resistance + rising support = price being compressed. Breakout typically goes in the direction of the prior trend. Enter just above/below the resistance line.
Flat support + falling resistance = compressed price range. The opposite of an ascending triangle. Breakout confirms the direction. Set target = triangle height.
Price makes higher highs, but with smaller waves โ momentum is fading. Eventually breaks downward. Stop above the wedge; target = height of the wedge start.
Price contracts lower but with narrowing range โ selling pressure is decreasing. Usually breaks upward. Caution: Often confused for a bearish pattern โ it isn't.
A chart pattern alone is not enough. The best setups occur when a pattern aligns with the broader trend, appears at a key support or resistance level, and is confirmed by your indicators (EMA, Stochastic). Stack confirmations, not just patterns.
Section 8
IntermediateThese are the exact indicators I use in my VIX Trading Strategy โ explained clearly with the settings I've personally tested and validated on Volatility Indices.
Every indicator in this section is a confirmation tool โ not a signal generator. Price action and market structure always come first. The indicators help you enter with more confidence and avoid bad timing. Never take a trade based on an indicator alone.
The most important skill in trading. Market structure refers to how price moves from one point to the next in a sequence of impulse moves and retracements.
On Synthetic Indices, support and resistance levels are respected far more consistently than in Forex because there's no institutional manipulation breaking them out of the blue.
The Fibonacci tool identifies where price is likely to retrace to after an impulse move โ the ideal entry zone for the next leg in the direction of the trend.
How to apply correctly: The Fib tool should ONLY be drawn from a clear Higher Low (HL) to a new Higher High (HH) in an uptrend โ or from a Lower High (LH) to a new Lower Low (LL) in a downtrend. Applying it to anything else is improper and the levels won't be respected.
If there's no new HH or LL formed โ the Fib tool is NOT applicable. I've seen traders get burned applying Fibs to equal lows or sideways ranges. Structure points must be valid.
The 80 EMA is my go-to trend indicator for VIX. It acts as both a trend filter and a dynamic support/resistance level.
The Stochastic tells you when a current market phase (impulse or retracement) might be coming to an end โ identifying overbought and oversold conditions.
Use in conjunction with the EMA and price action โ not in isolation.
The RSI measures how fast and far price has moved relative to itself. Useful for confirming when a reversal might be near.
Section 9
IntermediateThere are two main ways to trade Synthetic Indices on Deriv. Understanding both gives you flexibility in how you approach the market.
A CFD lets you profit from the price movement of a Synthetic Index without owning the underlying asset. You go long (buy) if you think price will rise, or short (sell) if you think price will fall. Your profit or loss is the difference in price ร your lot size ร position.
CFDs have no fixed expiry date and use leverage โ giving you the ability to control large positions with small capital. This is what I trade primarily on MT5.
MT5Deriv XcTrader
Options are fixed-risk contracts where you predict an outcome and receive a fixed payout if you're right. Your maximum risk is always your stake โ no margin calls, no surprises.
Options can be as short as 1 tick or as long as days. They're excellent for beginners because the risk is defined upfront every single time.
Deriv TraderFixed RiskSmartTrader
The simplest Option. Predict whether the exit price will be higher (Rise) or lower (Fall) than the entry price at the end of the contract period. Great starting point for beginners.
Choose a target price (barrier) and predict whether the market will be above or below it at expiry. Gives you more precision in entry targeting.
Predict whether price will or won't touch a specified barrier level at any point during the contract. Higher barriers = higher potential payouts but lower probability.
Your favorite for limited-risk, high-reward scenarios. Your stake accumulates with up to 5% compounding growth per tick โ as long as price stays within a specified range. The skill is knowing when to exit before the barrier is breached. Once triggered, you lose your stake + accumulated gains.
Select a multiplier (up to 2,000ร) and predict if price goes up or down. Your payout is amplified by the multiplier โ and your losses are limited to your initial stake. Includes stop loss, take profit, and deal cancellation features.
| Order Type | What It Does | Use When |
|---|---|---|
| Market Order | Executes immediately at current price | You want to enter right now |
| Buy Limit | Buy at a price lower than current market | Price expected to dip before rising |
| Sell Limit | Sell at a price higher than current market | Price expected to rally before falling |
| Buy Stop | Buy at a price above current market | Breakout strategy โ buy on new highs |
| Sell Stop | Sell at a price below current market | Breakout strategy โ sell on new lows |
| Take Profit (TP) | Auto-closes trade at your profit target | Always โ lock in your gains automatically |
| Stop Loss (SL) | Auto-closes trade to limit losses | Always โ protect your capital |
Section 10
IntermediateThis is the strategy I developed through years of backtesting and live trading. It's built on price action as the foundation, supported by a small stack of confirming tools โ nothing excessive, nothing unnecessary.
You don't need all 6 elements on every trade. Price action alone is enough for advanced traders. The indicators are there to confirm what you already see in price action โ not to replace it. When all elements align, that's your highest-probability setup.
All entries and exits are clustered around these three zones. When price reaches one of these areas, that's where you start watching for your setup:
Broken support/resistance levels that are retested โ the classic break-and-retest zones.
Dynamic support in uptrends, dynamic resistance in downtrends. Price often reacts sharply here.
The OTE (Optimal Trade Entry). When this aligns with the EMA, the probability goes through the roof.
Section 11
IntermediateI've traded across all 10 Volatility Indices and settled on these four based on how well my strategy applies to each one. Focus beats breadth โ always.
One of my personal favorites. Moves relatively fast and has the kind of energy that GBPJPY traders will immediately recognize. It respects price action beautifully โ the break-and-retest pattern is extremely prevalent here.
Key Observations: 25s prefers to break out and sometimes runs hard without immediately retesting โ the retest can come a day later. Fibonacci works best on the 2hrโ4hr timeframe for swing setups. For entries, use the 15mโ30m with EMA crossover confirmation from the 1hr. In strong trends, it breaks and retests HL points (uptrend) or LH points (downtrend).
A newer favorite that replaced VIX100 in my rotation. Very similar in personality to 25s, which makes it easy to analyze once you've learned one. The profit potential here is excellent.
Key Observations: Similar to 25s โ price action is primary. Loves to break and retrace to the 61.8โ70.5 Fib zone on lower timeframes. When it trends, it can trend hard for up to a week. Never fight the trend on 50s. Focus on minor ceilings and floors broken and retested around the 70.5 area.
My foundation index โ the one I developed the original strategy on. Note the minimum lot size of 0.10, which makes it less ideal for small accounts, but the profit potential on each setup is proportionally strong.
Key Observations: 100s loves to break out and retrace hard to the 61.8โ70.5 Fib area. These retracements offer sharp, clean entry opportunities. It can slow to a crawl and range for extended periods โ this is usually a precursor to a breakout, so patience is required. Once a daily zone breaks, 100s tends to move from one level to the next with clean structure.
The flagship. The most popular Volatility Index in the world โ and for good reason. VIX75 moves with conviction and when it trends, it tends to stay trending. It was the first VIX Index I ever traded, and it still holds a special place in my rotation.
Key Observations: VIX75 is forever bullish on the higher timeframe โ always bias toward longs on the big picture. The simplest strategy here is the Break and Retest. Capitalize on current momentum for short-term trades. Sometimes it ranges and coils before exploding โ be patient and don't force entries in choppy conditions.
Respect VIX75. When it moves, it moves fast. The minimum lot size has been reduced from 0.01 to 0.001 because accounts were getting wiped. Always size your position carefully before entering a trade on R75.
Section 12
IntermediateOnce you've got the fundamentals locked in, these strategies will help you expand your edge and diversify how you approach the market.
A systematic approach to trend following. Use a 6 EMA and 21 EMA on a 1-minute chart for short-term signals, or adapt the same system to any timeframe.
Ideal for traders who don't want to sit at a screen all day. Use the 1hr or 4hr timeframe with:
Buy: 20 SMA crosses above 50 SMA + RSI above 50 but below 70 โ enter on a pullback to the 20 SMA.
Sell: 20 SMA crosses below 50 SMA + RSI below 50 but above 30 โ enter on a bounce to the 20 SMA.
One of the oldest systematic strategies โ used by the legendary "Turtle Traders" in the 1980s. Works on Synthetic Indices surprisingly well.
Deriv offers a built-in browser-based trading bot that requires zero coding skills. You can set parameters, use ready-made templates, and automate your Option strategies.
You can also use cTrader Algo to automate CFD strategies โ including some of the systems covered in this guide โ and let them run 24/7 without manual intervention.
Always test automated strategies on a demo account first. A bot that runs profitably in backtesting can still fail in live markets. Monitor your bots regularly โ don't just set and forget without review.
Section 13
Every TraderYou can have the best strategy in the world and still blow your account without this. Risk management is not optional. It is the difference between trading for years and burning out in weeks.
The goal of risk management is not to win every trade. It's to ensure that losing trades don't cause you so much financial or emotional damage that you can't recover. A few well-managed profitable trades can outweigh multiple small losses.
| Index | Min Lot | Recommended SL | Target R:R |
|---|---|---|---|
| 25s | 0.005 | 15โ25 points | 1:4 / 1:6 / 1:10 |
| 50s | 0.005 | 20โ30 points | 1:4 / 1:6 / 1:10 |
| 100s | 0.10 | 100โ150 points | 1:4 / 1:6 / 1:10 |
| VIX75 (R75) | 0.001 | 50โ100 points | 1:4 / 1:6 / 1:10 |
Ask yourself: Do you want to be right, or do you want to make money? Those aren't the same thing. Most new traders need to be right more often than wrong โ but a trader who is right 30% of the time and uses 1:6 R:R is far more profitable than one who is right 70% of the time taking 1:0.5 R:R. Master your exits as much as your entries.
Section 14